


Financial markets are abundant with nuanced analyses, technical jargon, and fancy valuation metrics. However, I learned a long time ago that all of this stuff offers significantly more noise than it does signal.
That’s not to say that nuance isn’t important in finance, it is. However, distilling the details that actually matter is the tricky part.
Roughly a decade ago, I had a close friend who worked as an analyst at a hedge fund. One summer he was tasked with constructing a revenue and valuation model for a couple of the fund’s core positions. My friend was an MBA and held the CFA charter, couldn’t get much more qualified to do equity valuation work than this guy. Fade the scene and three months later he had constructed elaborate valuation and forecasting models for this hedge fund.
One of the stocks he had built a model for was NVDA. In 2015, his valuation model indicated that NVDA was overvalued and the company was likely to disappoint with its earnings growth over the next several quarters. His fund proceeded to trim its NVDA position and completely exited the stock by the end of 2015.
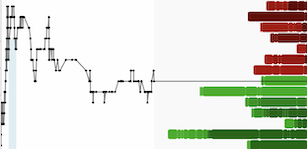
Here is the NVDA ten year chart:
NVDA (Monthly)

Suffice to say, my friend’s model didn’t get it right. And so as the sayings go “garbage in, garbage out”…. “predictions are difficult, especially about the future”.
A couple days ago I was part of a Copper Webinar with my friend Chen Lin. I giggled when Chen introduced me as a “technical analysis guru”. I am a guru in as much as I can identify clear trends and support/resistance levels on charts.
My experience over the last 20+ years has taught me that there are no gurus. There are smart people that are worth listening to from time to time, but nobody has it all figured out and markets are always there to humble all of us.
In today’s market environment, it is easier than ever to lose focus of the bigger picture and get caught up in something that serves to take our eye off the ball. In an effort to keep our eye on the ball, I’d like to highlight the long-term trends in the quarterly charts of my 3 favorite metals (copper, gold, and silver):
Copper (Quarterly)

Copper suffered a vicious bear market cycle between 2011-2015, and even as recently as March 2020 (Covid Crash) copper fell as low as $2.00/lb. A lost decade for copper has transitioned to delivering the most promising bullish setup in at least 20 years for the red metal.
Gold (Quarterly)

Gold is one of the clearest long-term bull markets of any major asset class.
Silver (Quarterly)

Silver had a crazy blow-off topping move in 2011 that caused it to become detached from the long-term trend. The subsequent correction and multi-year base-building period served to reset the chart and bring silver back to a more normal rate of ascent.
DISCLAIMER: The work included in this article is based on current events, technical charts, company news releases, corporate presentations and the author’s opinions. It may contain errors, and you shouldn’t make any investment decision based solely on what you read here. This publication contains forward-looking statements, including but not limited to comments regarding predictions and projections. Forward-looking statements address future events and conditions and therefore involve inherent risks and uncertainties. Actual results may differ materially from those currently anticipated in such statements. This article is provided for informational and entertainment purposes only and is not a recommendation to buy or sell any security. Always thoroughly do your own due diligence and talk to a licensed investment adviser prior to making any investment decisions. Junior resource companies can easily lose 100% of their value so read company profiles on www.SEDAR.com for important risk disclosures. It’s your money and your responsibility.
